LifeLog: Time Tracking
TLDR;

A year of time tracking and categorization with Timeular and Looker.
One of the projects that I've been working on is a way to track and quantify what type of work I do each day. This project came about after listening to a few podcasts by Cal Newport and then going down a Deep Work rabbit hole. I'm pretty sure that I was introduced to Cal's idea of Deep Work through Tim Ferris's podcast.
The idea is that you can't do your best work if you are constantly distracted by notifications, social media, and other interruptions. The solution is to schedule time to do deep work and then eliminate distractions during that time. I really think that goals and objects should have measurable outcomes or you should at least be able to track your progress. To that end I wanted to track how much time I spend doing "deep work" and how much time I spend doing "shallow work". I also ended up adding "meetings" since I found that was a big part of my day.
Therefore I have 3 categories of work that I track:
- Deep Work
- Shallow Work
- Meetings
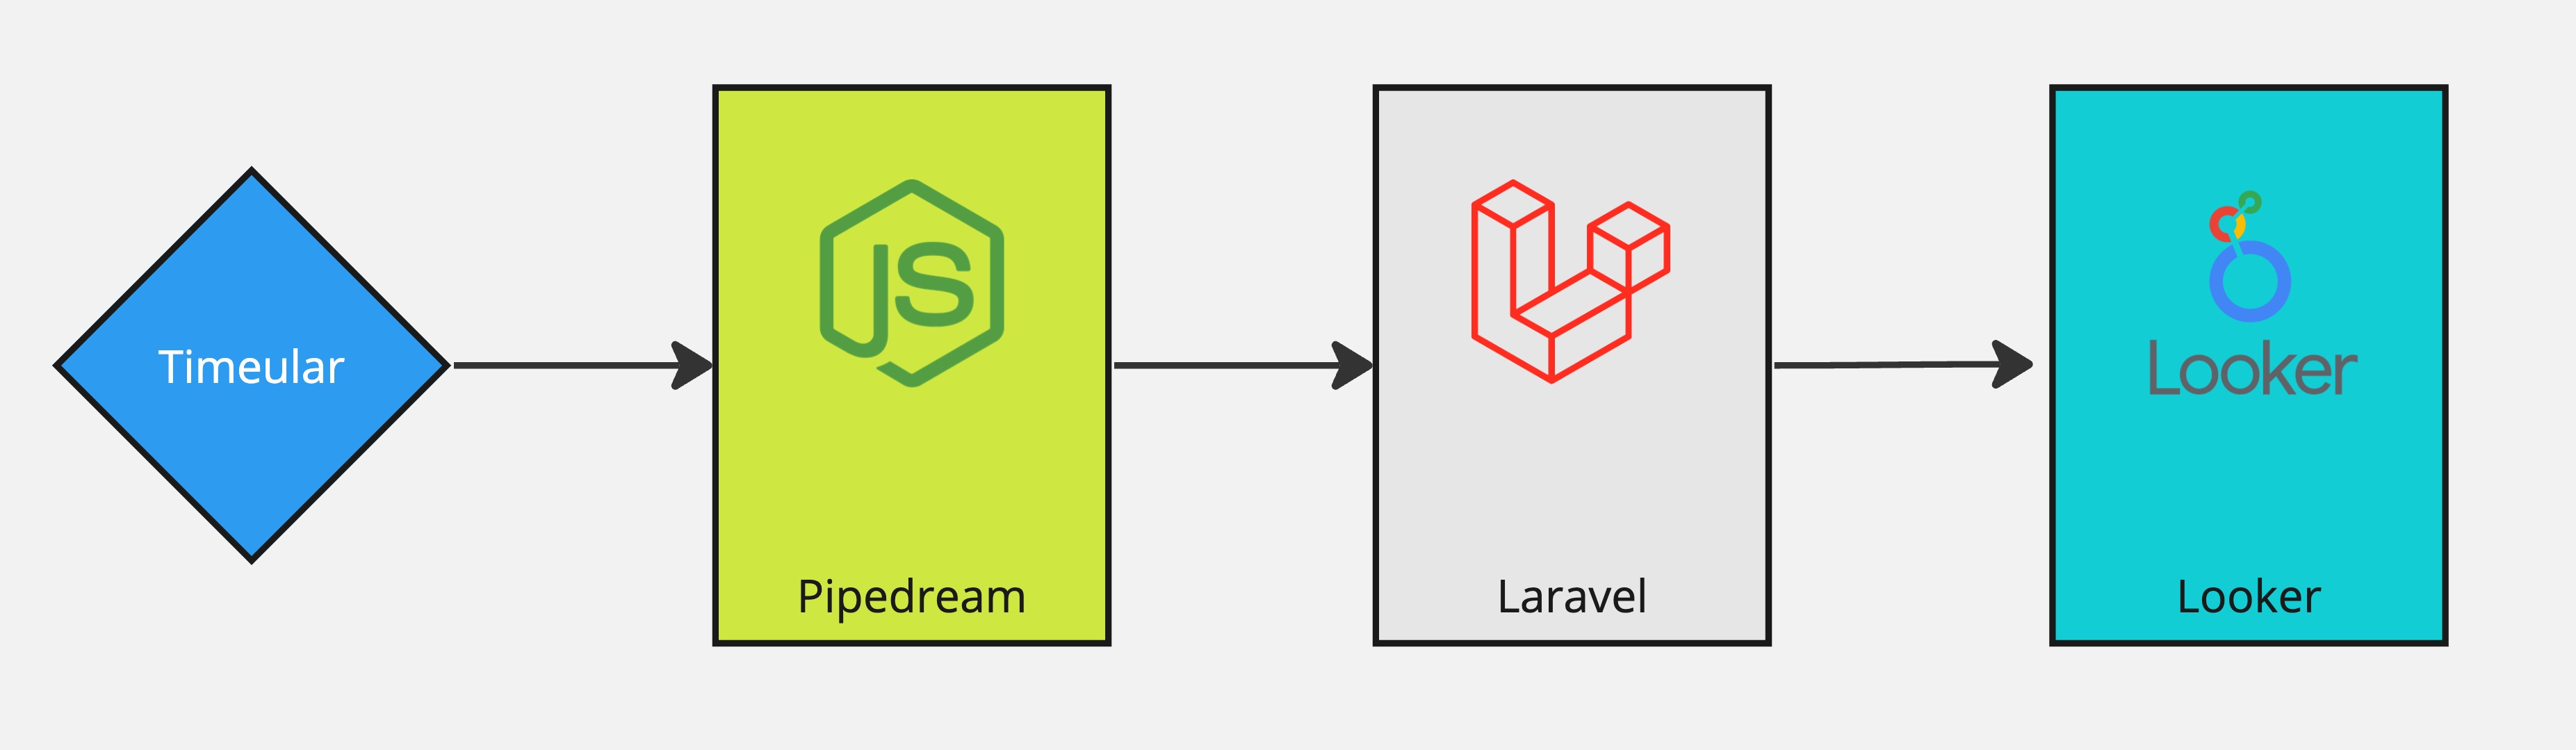
The setup ended up like this. I use timeular to track my time at work. I have a Timeular ZEI on my desk and I use the Timeular Desktop App to track my time. I created three tags which I use to categorize the type of each task that I work on during the day.
The Timeular app has the ability to create webhooks that fire on certain events. I am using create, update, and delete. The webhook sends it's payload to a Pipedream workflow. The workflow is a Node.js script that receives the webhook payload, does a little bit of mapping, and then sends the data to a custom API. The API is a Laravel application with a MySQL database where the data is stored.
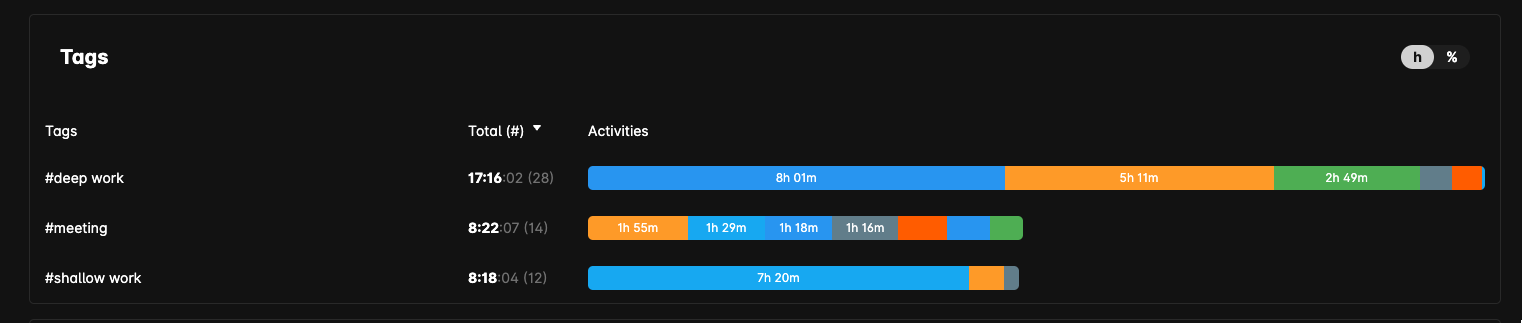
That takes of collecting the raw data, the next step is to present it in a useful way. To to that I used Google Looker Studio to injest the data and create a report. I tried a few different visualizations but the one that I landed on is three timeseries, one for each label. The timeseries shows the total time spent on each label for each day. I also added a filter so that I can select a date range and see the total time spent on each label for that date range.
The results for graphing all of the data is below. The time span is a little over a year.
The original goal was to increase time spend in deep work by decreasing time spend in meetings and shallow work. Looking at the data it's a little hard to determine whether or not I have been successful over the past year. The graphs look basically flat however there ARE some distinct periods here and there where I was able to increase deep work time.